Modules
Data Analyst
Data Engineer
Product Data Scientist
AI Engineer
Machine Learning Engineer
Prompt Engineer
In our previous course, we explored the use of PERCENTILE_CONT to calculate the median or find the top percentile values. And we specifically set the percentile we were interested in.
Now, imagine being able to determine the percentile for any given value.

This can be super handy when you need to identify users or companies that are in the top percentile.
Let's go through a real example using our favorite salaries table:
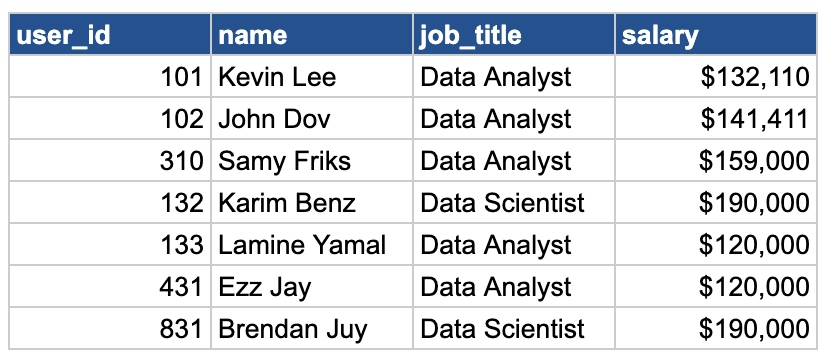
Our goal is to understand how each employee ranks in terms of their salary percentile. Let's see how we can do that in SQL:
SELECT
    user_id,
    name,
    job_title,
    salary,
    PERCENT_RANK() OVER (ORDER BY salary) AS percentile_value
FROM salaries;
This query calculates the percentile rank for each salary, ranging from 0 (lowest) to 1 (highest), based on the order of salaries. The highest salary gets a percentile rank of 1, while the lowest gets 0.
But what if we want to analyze specific job titles, like Data Scientists and Data Analysts, in terms of their salary percentile? We can add to our query PARTITION BY:
SELECT
    user_id,
    name,
    job_title,
    salary,
    PERCENT_RANK() OVER (PARTITION BY job_title ORDER BY salary) AS percentile_value
FROM salaries;
Great! Now let's practice this new concept! 😍😍